Recall the shape of the histogram plotted in the previous exercise. Here it is again:
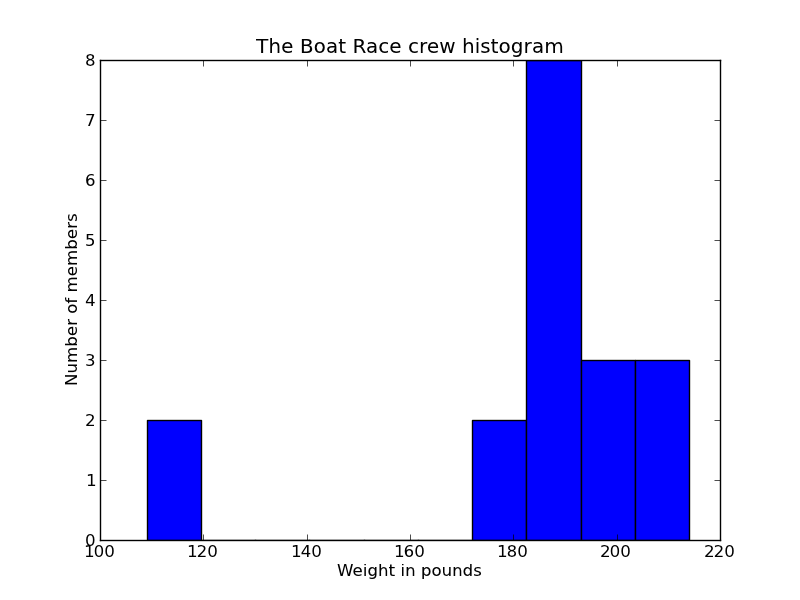
One would think that the crew of the Cambridge and Oxford rowing teams would have similar weights, or at least not such divisive weights. Out of 18 crewmembers, 16 of them weigh between about 170 and 210 pounds. The other 2 crewmembers, on the extreme left of the plot, look like outliers. Both weigh some 60 pounds fewer than the next-lightest members. Outliers are often obvious when data is graphed because one or two bits of data will be far away from the rest of the data. Sometimes outliers are caused by errors in measurement (e.g. two of the rowers were measured on an innacurate scale) and could be ignored. At other times, outliers may be due to some underlying cause. It can be difficult to determine which may be the case.
Recall the rowing research you performed several exercises ago. The term coxswain is associated with rowing, especially with large nine-person boats like the data we have. A coxswain is a boat's navigator and timekeeper, but he or she does not actually row the boat. Thus, coxswain's tend to be small('ish) individuals so they don't add unnecessary weight to a racing boat.
Briefly return to Exercise 6 and look for the two lightest crewmembers in the data table. You will see that the two team members with the lightest weights both have the position "Coxswain". So coxswains' are outliers because they are different than a "Rower", who tends to have greater physical bulk to move the race boat.
With and without the lightweight members
Calculate the mean weight of both crews, then the mean weight without coxswains, and finally plot a graph:
import pylab

# Create our mean function
def mean(data):
    return sum(data)/len(data)

# Data for all 18 crew members
cambridgeWeights = [188.5, 183, 194.5, 185, 214, 203.5, 186, 178.5, 109]
oxfordWeights = [186, 184.5, 204, 184.5, 195.5, 202.5, 174, 183, 109.5]
totalWeights = cambridgeWeights + oxfordWeights
print "Mean weight of both rowers and coxswains: ", mean(totalWeights)

# Data for just 16 crew members, without coxswains
cambridgeWeightsNoCox = [188.5, 183, 194.5, 185, 214, 203.5, 186, 178.5]
oxfordWeightsNoCox = [186, 184.5, 204, 184.5, 195.5, 202.5, 174, 183]
totalWeightsNoCoxs = cambridgeWeightsNoCox + oxfordWeightsNoCox
print "Mean weight of rowers without coxswains: ", mean(totalWeightsNoCoxs)

# Create a graph by overlaying 2 histograms
pylab.hist(totalWeights, label="rowers and coxswains")
pylab.hist(totalWeightsNoCoxs, label="rowers only")

# Add labels
pylab.title("The Boat Race crew histograms")
pylab.xlabel("Weight in pounds")
pylab.ylabel("Number of members")
pylab.legend(loc= "upper left")

# Display graph on screen
pylab.show()
Save this program as rowers-and-coxswains-graph.py.
The result is...
After clicking Run, your screen will first display the means:
Mean weight of both rowers and coxswains:  181.416666667
Mean weight of rowers without coxswains:  190.4375
Then a graph will appear.
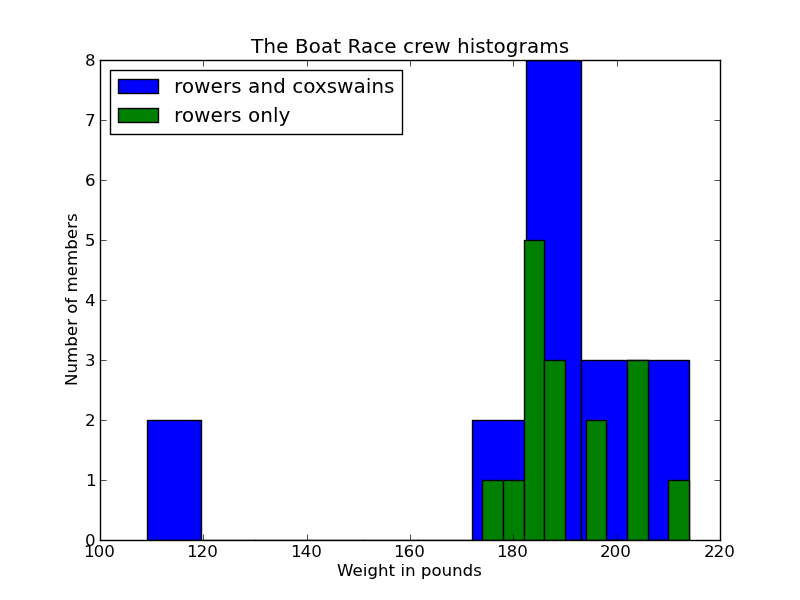
If we ignore the two coxswains' weights, we get an average weight that is more representative of a typical rower.
Mentally plot where the two means are located on the above graph to see how the mean is greatly affected by the coxswains' low weights.
As this dataset exemplifies, mean is not a robust estimator of data. The presence of two left-side outliers greatly skewed low the mean weight. Without the outliers, the mean weight increases.
To overcome the limitations of mean, statisticians like to calculate a dataset's median, which is a robust estimator.


Learn Stats in 10,000 Hours by Jonathan B. Miller is licensed under a Creative Commons Attribution-NonCommercial-NoDerivs 3.0 Unported License.